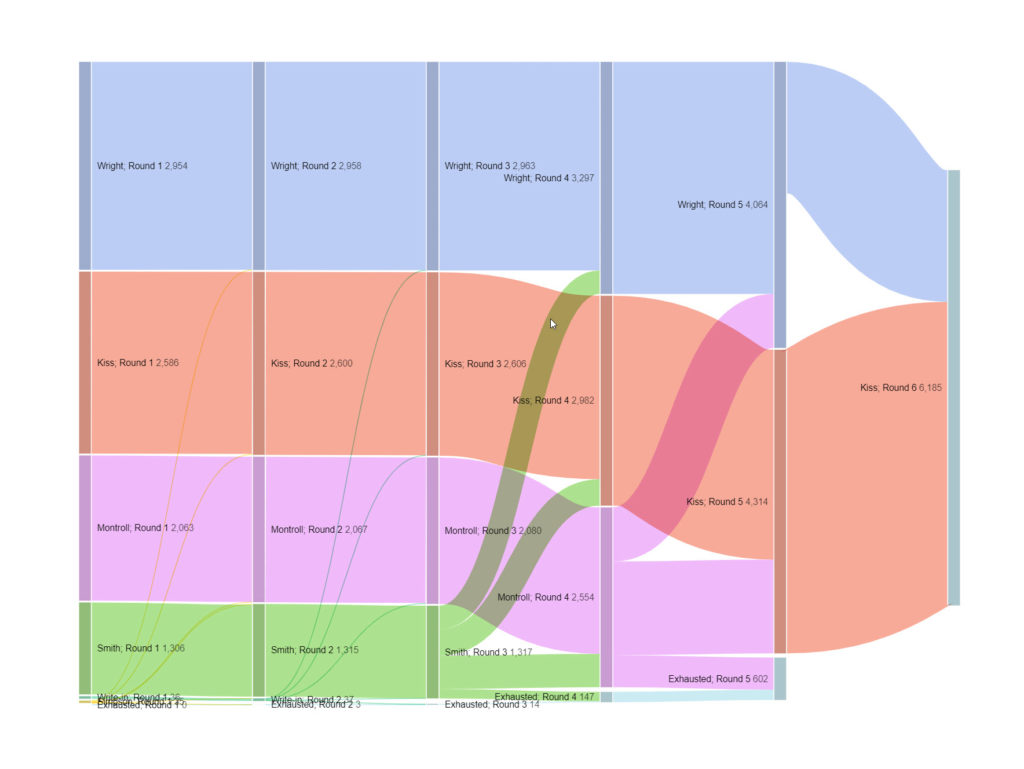
Here’s a video I created to illustrate how things played out in for a memorably controversial ranked choice election in Burlington Vermont, in 2009. It includes a Sankey chart of the Instant Runoff, plus data visualizations of tabulations using both the Borda and Condorcet methods.
