A leading charge against New York City’s old election system was that it used a plurality model that too often failed to deliver broadly-popular leadership. That “first-past-the-post” system was adequate for races with only two candidates running, but crowded multi-candidate contests were subject to a notorious side effect… base-oriented politicians having a relatively narrow popular appeal could prevail with shrinkingly small pluralities. That was how Bill de Blasio won the Democratic primary (and effectively, the Mayor’s office) with under 41 percent of the vote in 2013. Reaction to that widely dissatisfying result was, in part, why New Yorkers eventually decided to gamble on an unfamiliar but reasonable-sounding alternative called ranked choice voting.
Not surprisingly, RCV proved easier to put into law than actually implement. The November 2019 charter amendment to adopt RCV for primary and special elections had passed 74 percent to 26 percent. Reading election results from New York City would never be so easy again.
New York’s municipal primaries, scheduled for June 22, 2021, had thus been set as the largest ranked choice election ever to be held in the USA. As the day approached, RCV proponents were thrilled, fully expecting a surge of interest that would accelerate adoption across the rest of the country. Meanwhile, opponents shared a “rueful chuckle” about the chances that things would go badly in New York, and that a “backlash” against RCV was on the horizon.
New Yorkers had effectively taken it upon themselves to pilot a rollout of a new model for American elections. A challenge of that magnitude was bound to involve some stumbles, but from inside a high-stakes New York-scale media fishbowl, every observable misstep was bound to be amplified. That was the context in which New York City’s Board of Elections committed the mother of all blunders, publishing a hot mess of obviously invalid preliminary results after a full week of vote counting. A “discrepancy” is how they described it
The BOE’s error gave America its story of the day, racking up headlines such as “New York’s Ranked Choice Fiasco” and “New York hands Trump a victory on election unreliability.”
It was sad and embarrassing. New Yorkers had squandered a massive opportunity to showcase their city as a heroic champion for repair and upgrade of American democracy. This was not a good answer to Hong Kong.
Despite ample reports of chronic dysfunction at the BOE, some critics sought to focus blame on the ranked choice voting model itself. Joe Scarborough, for example, barked out a verdict of chaos, confusion, and Jim Crow 8.0.
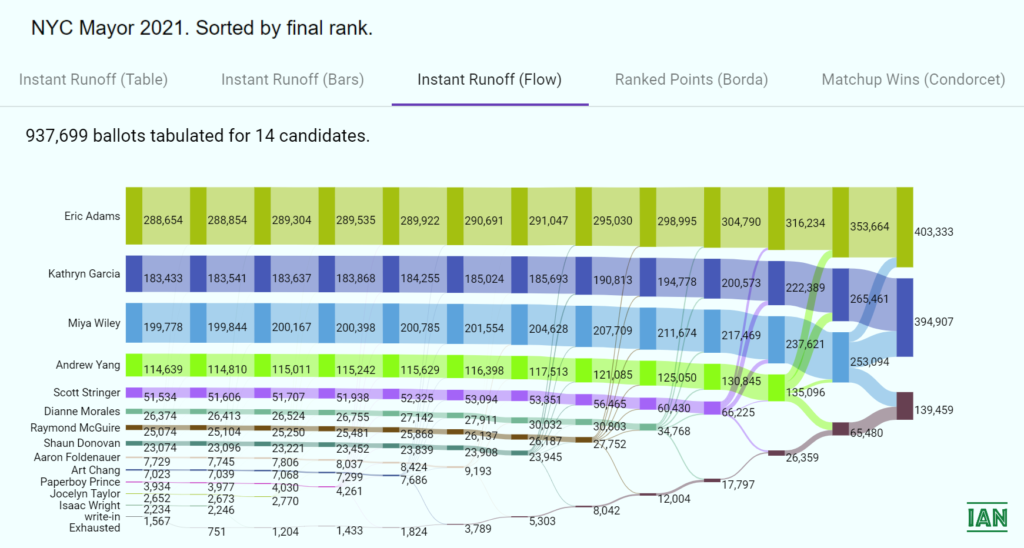
Nevertheless, the crisis passed. The Board of Elections had at least given itself ample time to get things right in the end. The victor was declared, the losers properly conceded, and public opinion research indicated RCV was now even more popular among New Yorkers than when they adopted it in 2019. Americans finally got a good look at the world of ranked choice results on July 6, when the New York Times published a data-visualization based on a corrected and updated but not yet final Board of Elections tabulation.

Unfortunately, there are still some problems with the BOE data. Despite the Democratic primary having 14 candidates, results for only 8 rounds were published. The gaps should be concerning given expectations of transparency, but it’s not a problem that impacts the final standings. In any case, data from the earlier missing rounds can interpolated to give a fuller picture of the elimination process. Hopefully, complete information will be made available before long (But my requests to the Board of Elections for access to the complete Cast Voter Record have gone unanswered so far).

The surprisingly large exhausted ballot count is potentially another bad look for this election. That suggests that lots of so-called “bullet voters” refused to take advantage of the ranked choice system by ranking only one candidate. This is perfectly legal, of course, but undercuts the argument of RCV proponents that the system delivers candidates who have earned majority support among voters. Another possibility is that many voters wanted to rank more candidates, but didn’t get a say on the final battle because New York’s Top 5 system provided too few ranking options for a field with over a dozen candidates. Again, access to the complete Cast Voter Record would help surface the details.
The following series of stacked bar charts presents another way of displaying the size of the exhausted ballot count.

Political scientists and professional pollsters are undeniably hungry for more detailed data than the BOE has made generally available so far. Important insights about voter intent simply can’t be interpolated from the aggregated round-by-round results. How much bullet voting was there? Did it really matter for a candidate to have the broad appeal that RCV proponents claim is key to winning under this system? Or can the fierce unity of one’s base prove decisive?

If the race had been tabulated using the highly respected but more complex alternative known as the Condorcet method (essentially adding up wins from a series of matchups on each ballot), would Adams have won that way as well? If yes (which I believe is more likely than not), then RCV proponents would be delighted. That outcome would fortify confidence that the instant runoff system used in New York had not only spared the city the extra expense of a separate Top 2 runoff election, it had also successfully helped the voters elevate the most broadly preferred candidate. Learn more about the implications of different ranked choice tabulation methods here.
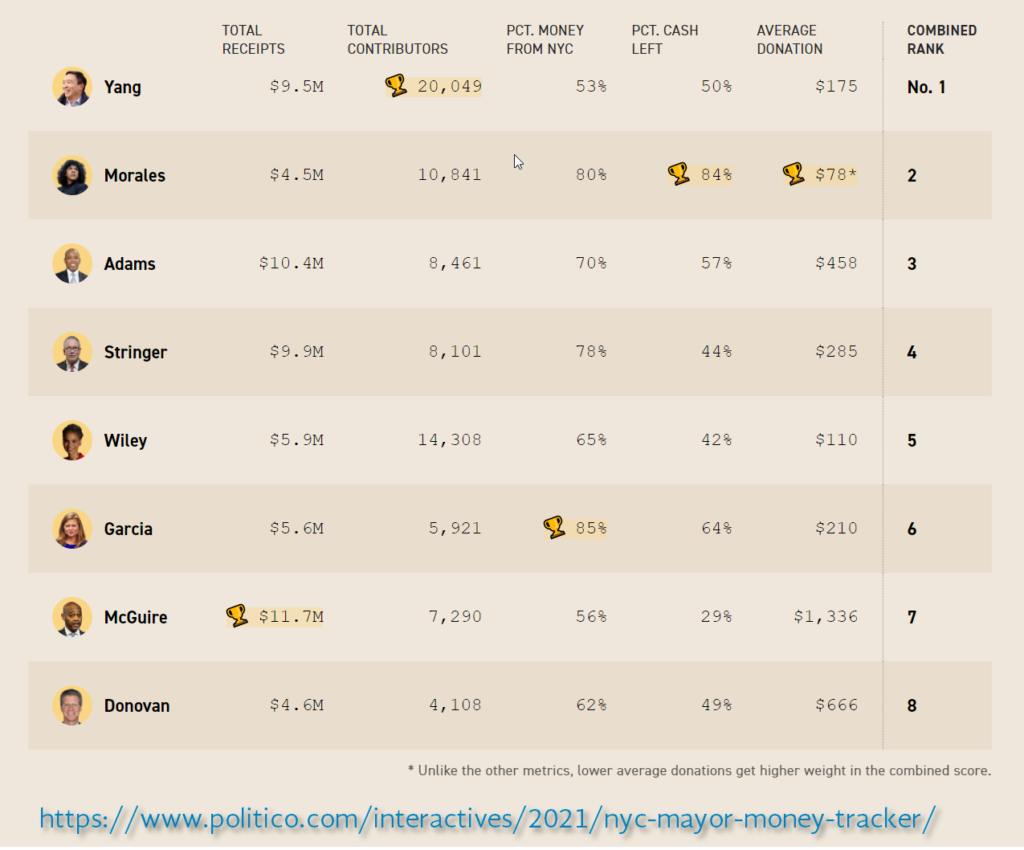
Parenthetically, while preparing this material, I had considered creating a “votes-per-dollar” bar chart comparing each candidate’s 1st round votes received as a function of dollars spent by their campaign. In researching that issue I came across this delightful chart published the week before the election on Politico.com. It doesn’t ask “votes-per-dollar” question directly, but does a great job helping us anticipate the answer.
Finally, consider a few key lessons from this journey:
1) There’s nothing new in saying that confidence in outcomes of sharply-contested elections depends on having a professionally managed and transparent election administration structure. That’s why New York’s troubled Board of Elections will stay the hot seat for the time being, while the Ranked Choice Voting Resource Center, with its nationally certified tabulation process, emerged strengthened and more respected.
2) Ranked choice voting is not nearly as complicated as its opponents have incessantly claimed. When voters have “skin in the game” via a rooting interest in a particular candidate, then the challenge of coming from behind (or preserving a lead) in a multi-round instant runoff race turns out to be easily understood. In learning, motivation counts. At the end of the day, RCV is simple enough that anyone can recognize who won, and how.
3) Naysayers feel emboldened, nevertheless. Disappointments such as the overly long tabulation process, the botched publication of preliminary results, and the high exhausted ballot count can’t be ignored. Defenders of the status quo in the US election system certainly won’t forget them. New York’s June Primary failed to become the showcase for democratic renewal many hoped it would be. But the setbacks weren’t more than that. Despite this unhappy bump in the journey, momentum for adopting more inclusive and fair balloting processes across the United States certainly hasn’t reversed. Perhaps it hasn’t even slowed.

