Burlington Vermont’s 2009 Mayoral race provides a great example for visualizing the results of ranked choice elections. It’s the most consequential real-world case where a Condorcet winner beat a runoff winner (the legally elected winner), but where both beat the plurality winner.
If you like controversy, you’ve come to the right dataset.
There’s more about that election here and here. There’s an unexplained difference pertaining to four exhausted votes between the data I transferred and the official results, but the point is to showcase these new data visualization experiences, and those quirks don’t affect the outcome.
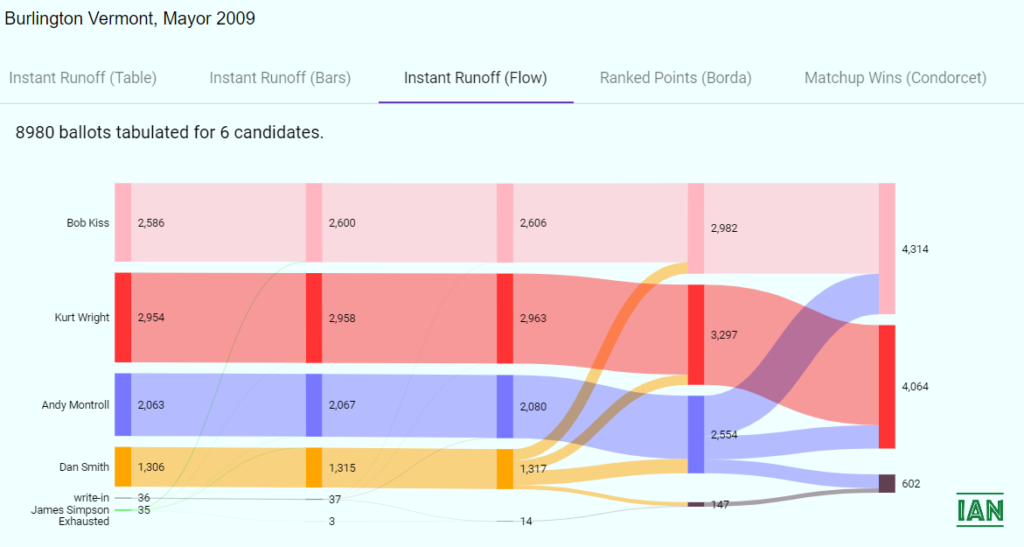
Sites associated with Indaba Application Network (IAN) are now able to present four visualizations that can help voters understand how ranked choice voting works to reflect their collective intent. Since most jurisdictions are using Instant Runoff tabulations, I’m presenting two charts — stacked bar and Sankey — and a data table to illustrate that how that method played out. Those will be followed by chart arrays presenting Borda and Condorcet results.
Here’s the rendering of the Sankey chart.
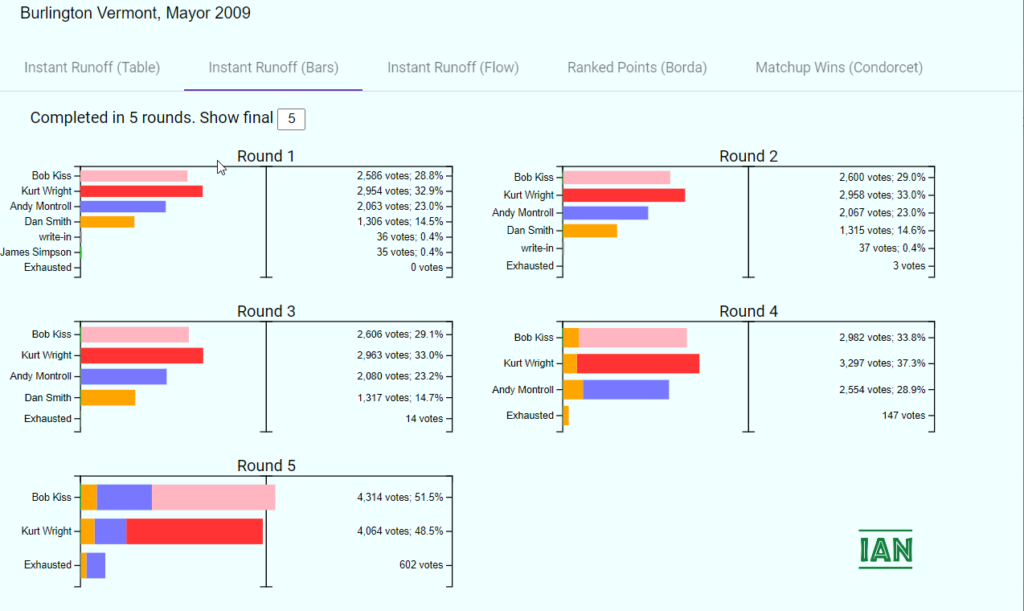
In the chart below I decided to present the stacked bar visualization separately for each round rather than with the round-by-round interactive click-through component that’s been the traditional way of presenting runoff results. This is because: 1) Printable dataziv can be served across more kinds of media, and; 2) It allows better amplification of details that might matter most in the final rounds.
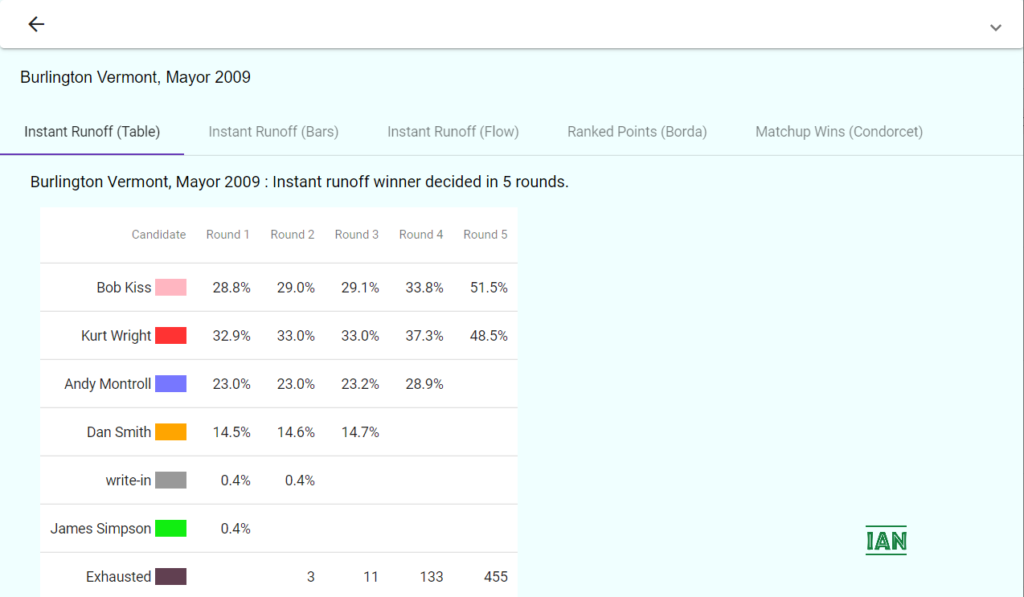
The next image is a table of percentages that might be popular with the “just the facts, ma’am” numerically inclined. Note that the exhausted ballot counts are shown individually by round here, while the previous visualizations summed the exhausted counts round after round. FYI, I chose these colors… Progressive Pink, Republican Red, Democratic Blue, Independent Orange, and Green Green… to help tell the story about how the race played out.
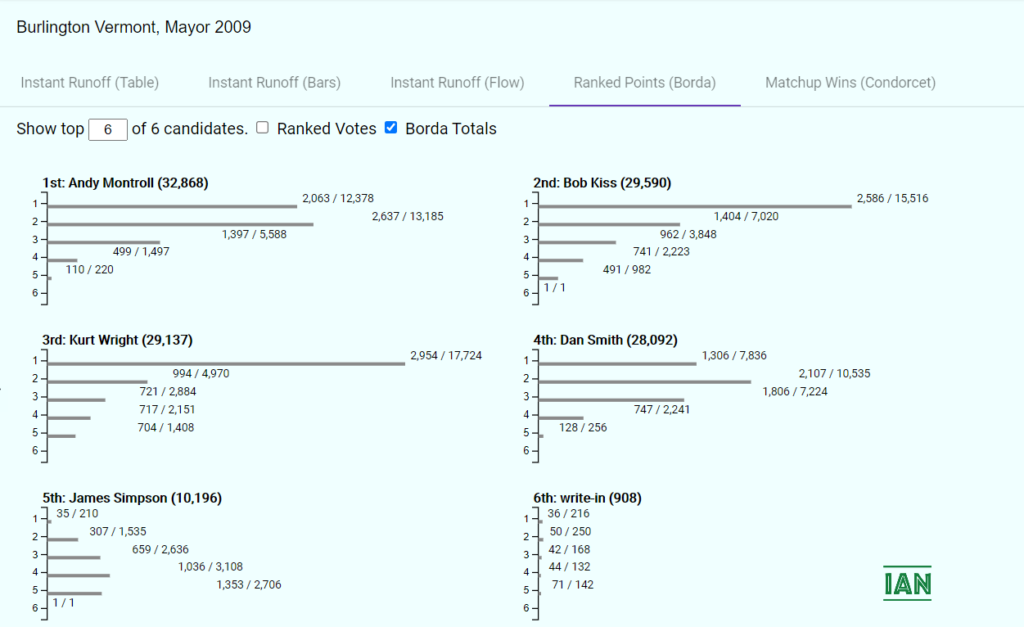
The Borda method is generally considered to be the least reliable of the ranked choice tabulation algorithms. It’s arguably more vulnerable to gaming. Nevertheless, by leveraging a format akin to the “Customer Review” ratings on Amazon.com, the charts shown below provide a simple and familiar perspective on how candidates performed. These raw details can be exceptionally revealing. Note the relative concavity or convexity in the shape of the vote distributions. It’s evident that the plurality winner was all base with little depth, while the Borda winner (who was also the Condorcet winner) had undeniably broad appeal despite placing a lowly third in first round, first place votes.
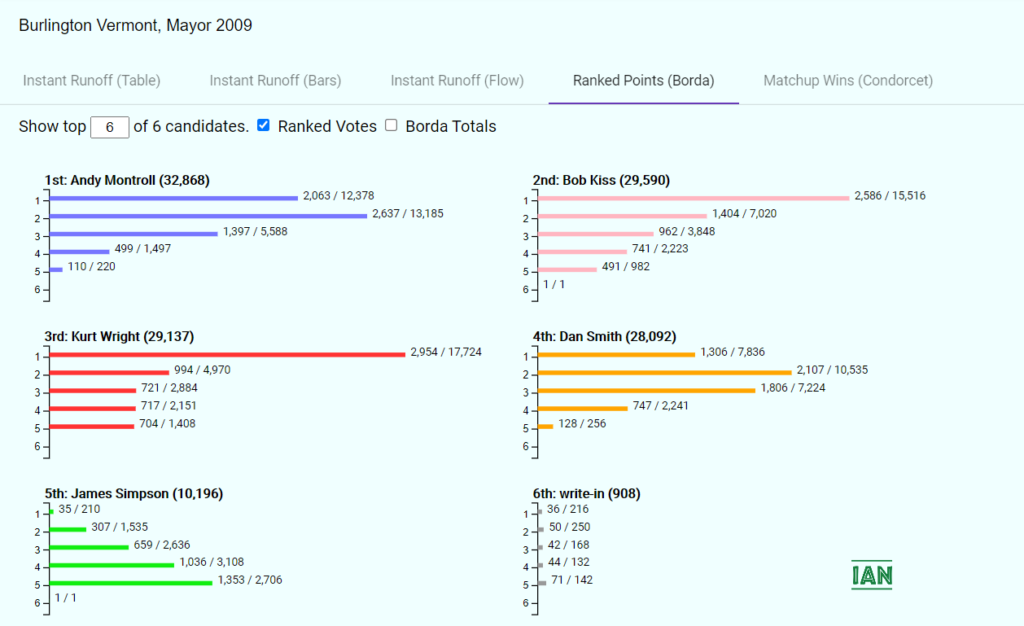
Highlighting the Borda totals alone (here counting 6 points for each 1st choice, 5 points for 2nd, etc.) shows even more starkly the potential cost of being a polarizing candidate versus the value of being a generally acceptable one… depending on the tabulation algorithm, of course. This exposes one of the most persistent complaints about the Instant Runoff algorithm… If an electorate is deeply divided on first choices, but all voters have the same second choice, AND if that undeniably acceptable second choice happens to receive the smallest number of first choice votes, the unhappy consequence is that the candidate most likely to reflect the community’s best possible chance at consensus would wind up as the first to be eliminated.
Fortunately, this is rare. But it happens. Which is why Burlington presents such an intriguing example.
Typical Condorcet visualizations combine the results for all the candidates within a single grid, saving lots of space at the expense of easy readability. The alternative shown below breaks out each candidate’s details into separate charts, simplifying the challenge of sorting through matchups. This style of display is intended to showcase the “round robin” aspect of the Condorcet pairwise tally method by getting to the bottom of the ultimate political question, “Who crushed whom?”
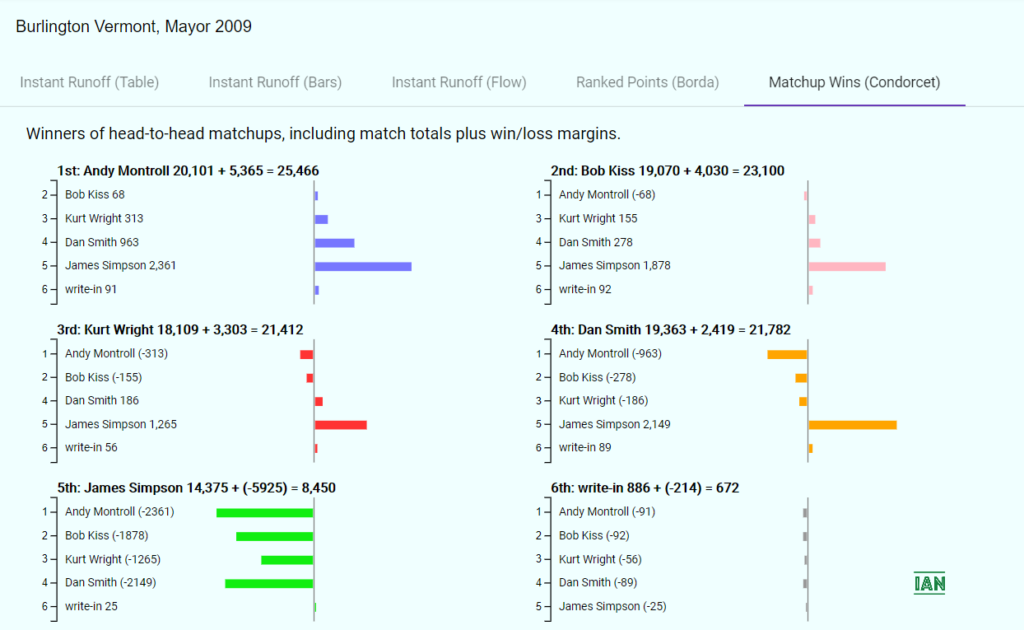
There are no surprises here. The results and anomalies of this Burlington race have been picked over many times since 2009. The Instant Runoff tabulation system was no help to Republicans who may have considered the Democrat less unpalatable than the Progressive. Yes, it’s apparent from the low number of match totals that many Republican voters marked no other ranks on their ballots. But it wouldn’t have made a difference. Their candidate was the last to be eliminated and their second choice — under those rules — was of no consequence.
The outcome would most certainly have been the same with a special runoff election between the Progressive and the Republican, so at least ranked choice voting saved everyone in Burlington some time and expense. But the Republicans were furious and the Democrats were meh after this election, so the old system was restored.
As the use of ranked choice voting has become more widespread across the United States, the plurality winner has typically been the instant runoff winner… by far. So, other than inescapable post-election sore-loser complaints, there have rarely been serious reasons for controversy.
However, as candidate counts proliferate and political ideologies fractionate, the likelihood of Burlington-style events will increase. This article is being posted just days before the Democratic Mayoral Primary in New York City, so anticipation and speculation is reaching a high. But it’s clear that if Americans want reforms that can break the polarizing cycle of two-party duopolies, systems that optimize for elevating center lane candidates offer the strongest promise to do so. Ranked choice ballots are a good first step… but not the last.
Interested in trying out a ranked choice straw poll? Check out Mayor21.com.

